
Visualize Your Helium Miner’s Wireless Coverage With This Free Tool
Over the past few months, HNTnews has covered some simple actions that an investor can do to improve their miner’s range. However, in many cases finding out how these efforts will increase their range has been difficult. That’s left many investors in the dark about whether spending money on their miner setup will have an impact on their earnings.
However, thanks to a tool from CloudRf.com, a lot of the guesswork can be eliminated. The tool uses GIS mapping data and imaging LIDAR from satellites to create a 3d map of the world, which can then be used to determine how your Helium Miner’s signal will propagate based on some variables you input into the tool.
UPDATE: Changes to Free Plan
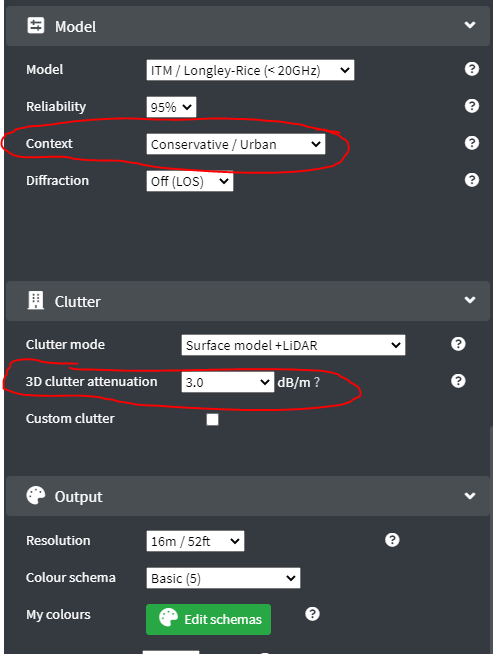
Unfortunately, the CloudRF team has significantly reduced the limits of the free plan to a maximum of 500MHZ after this guide was written. This has an impact on Helium because it operates in the 800-930mhz range. BUT, I have found a simple workaround. Follow this guide except for these three variables: Set the frequency to 500MHZ (the maximum allowed) and then set the context to conservative/urban and the 3D clutter attenuation to 3.0. This will give you comparable (but not perfect) results.
ALSO, please consider purchasing this tool if you are looking for perfect results. The CloudRF team has been very gracious with their letting us use the tool for free and because of the high compute requirements it is very expensive to maintain the servers. I have a feeling they had to make these changes because they have been hugged to death and need a way to pay server costs.
Why Would You Want to Know How Far Your Helium Miner’s Signal Travels?
The fastest way to increase your miner’s HNT earnings is by increasing the number of witnesses it has. When your miner witnesses another miners’ beacon (basically a “Hi I’m over here” in RF speak), the miners all get rewarded for Proof of Coverage. This helps to build out the network by incentivizing miners who are adequately providing coverage.
As an investor, you obviously want to get rewarded for making the most of your miner’s signal. This is a great tool that will help you to see what you’ll need to do to increase your coverage – which can be as simple as mounting your antenna outdoors or can require mounting your antenna on a tower to get it above the treeline.
Here’s How to Use the Wireless Auditing Tool
Settings Update:
After this article was published, the user Jimv provided some more accurate information for the tool, please check the chart below for the most accurate information to use for the tool.
| Setting Name | Value |
| RF Power (Step 6) | 20 dbm |
| Bandwidth (Step 6) | 125 Khz (0.125Mhz) |
| RX Sensitivity (Step 9) | -120dBm |
Time needed: 15 minutes
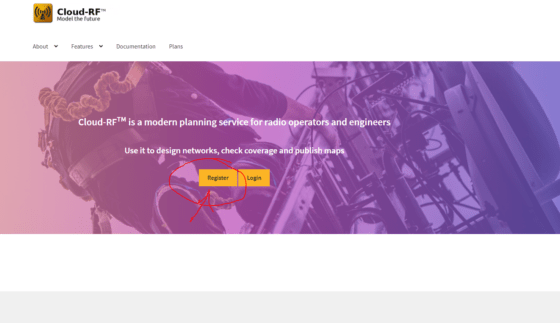
- Go to cloudrf.com and create an account
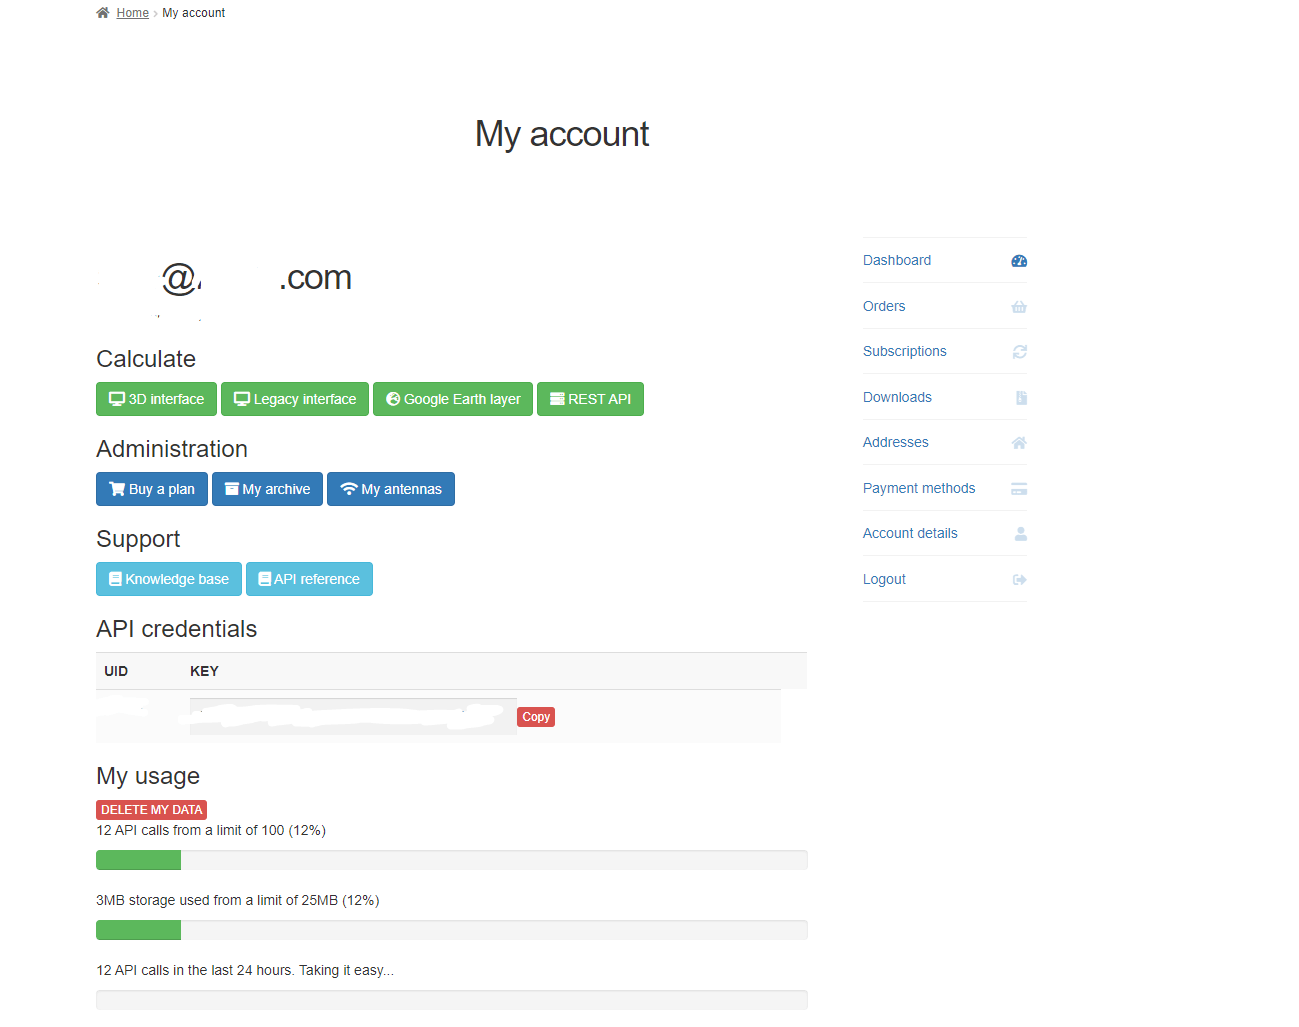
CloudRF allows non-commercial use of its product, you get up to 100 API calls for free, and you can reset your account in the preferences tab if you run over.
- Open the CloudRF tool and open the pane on the left-hand side of the screen
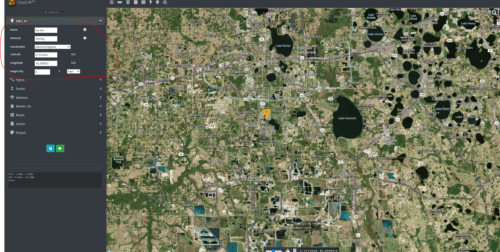
- Login to the tool in your account
- Click on the Site/RX tab
The next steps will describe what each of the settings does and what your default configuration should be
- Site/RX Settings
Name– Name of Your site
Network – the name of your network (not required)
Coordinates – leave default
Latitude – leave default
Longitude– leave default
Height AGL – input the height of your antenna above ground. For example, if your antenna is on the second story put in ~20 feet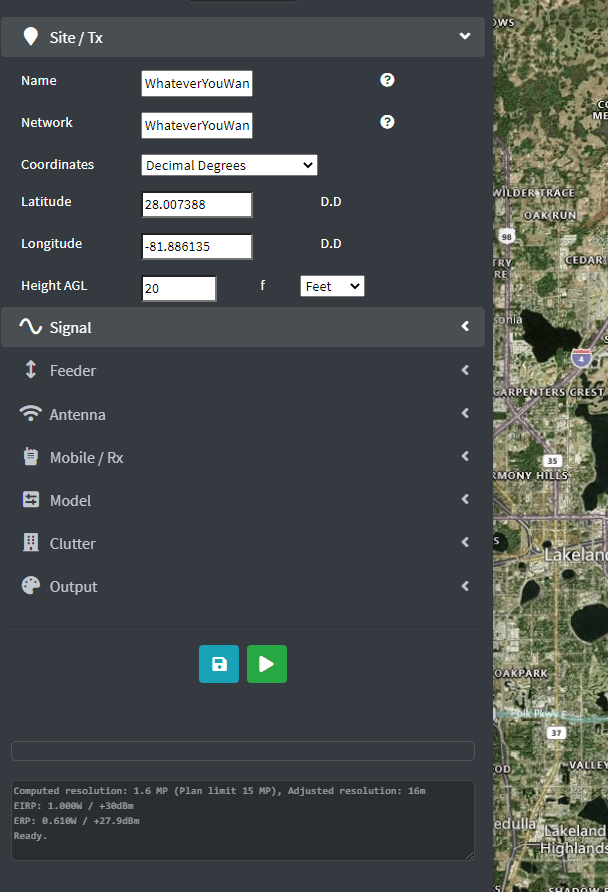
- Signal Settings
Frequency – If USA put in 915MHZ, EU 868MHZ, China 868MHZ
RF Power – 14 DBm
Bandwidth – 0.250 MHz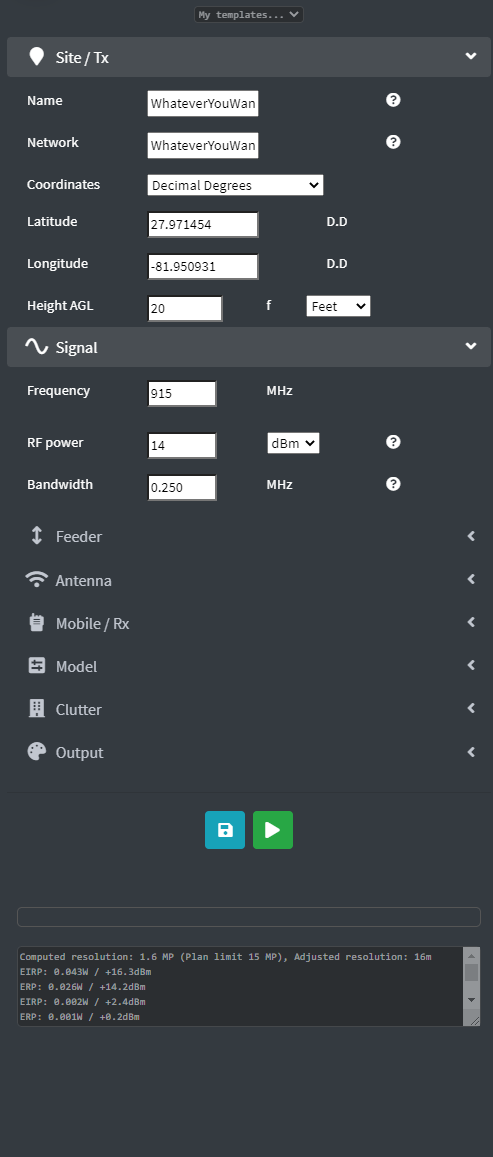
- Feeder Settings
Coaxial Standard – the type of cable you are using (it’s usually printed on the cable) If unsure just put Belden 8212.
Connectors – number of connectors used (default 2)
Loss- this is calculated
Efficiency – this is calculated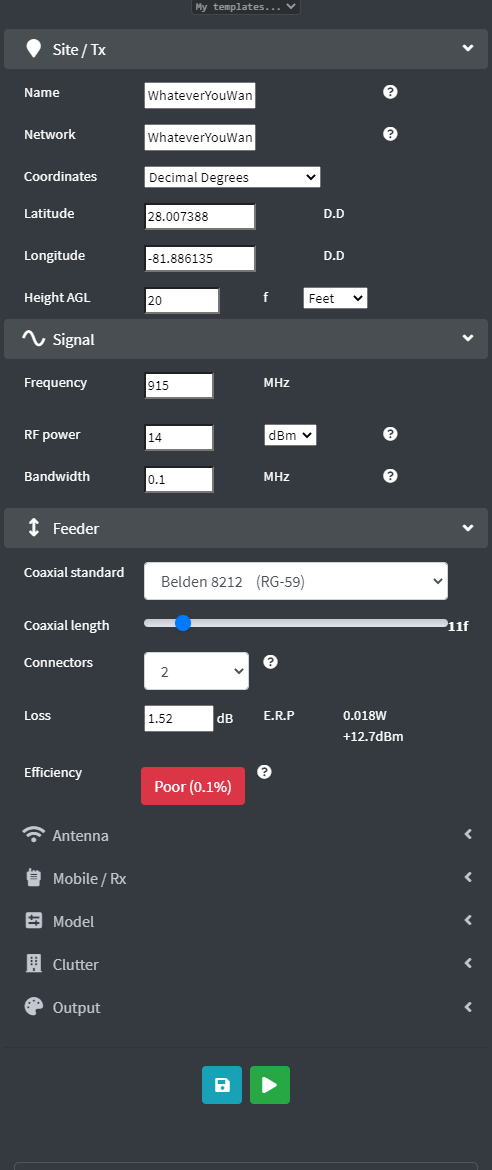
- Antenna Settings
Pattern – Default. Half Wave Dipole
Polarization – Check your antenna specifications. Default=Vertical
Gain – Check your antenna specifications. Default = 3 DBi
Azimuth & Down Tilt = Default = 0 deg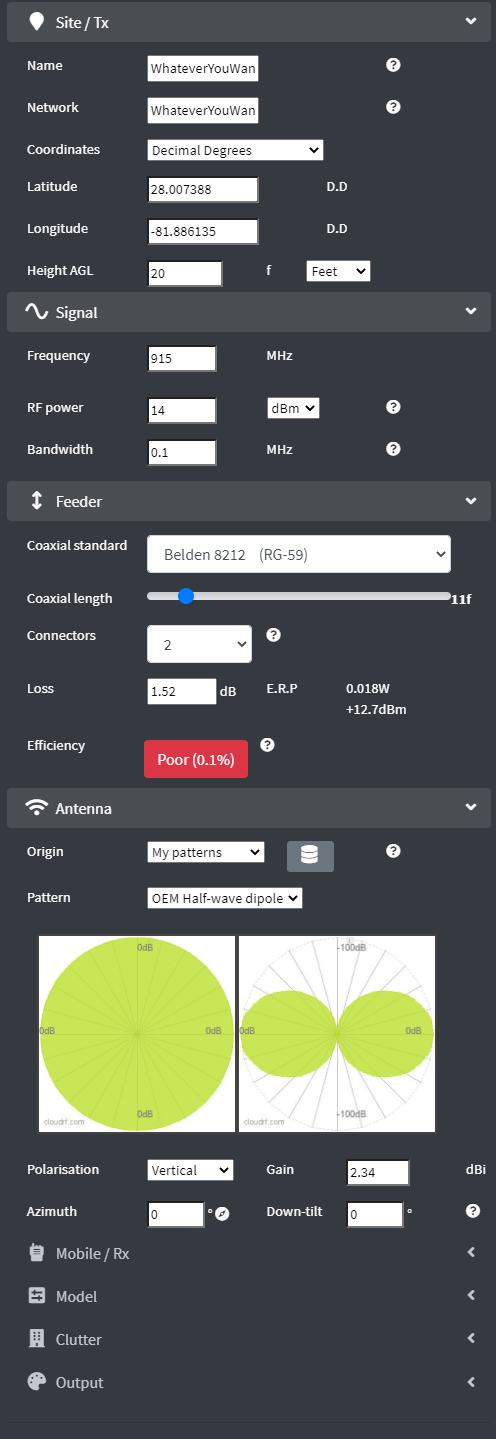
- Mobile/ RX Settings
These settings have to do with the specifications of your receiver radio. If your radio will be an end-user IoT device, then it will be very different that another miner (who will probably have a setup similar to the TX miner. This guide will assume that the RX radio will be an IoT device
Height AGL – height of the Rx radio. Default – 8 db
Receive Gain – the gain of the Rx antenna. Default – 3db
Sensitivity – this is the DBm of the radio hardware (can be found in specs). Default = 90db
Noise Floor – this is related to the environment noise and depends on location. Default -110DBm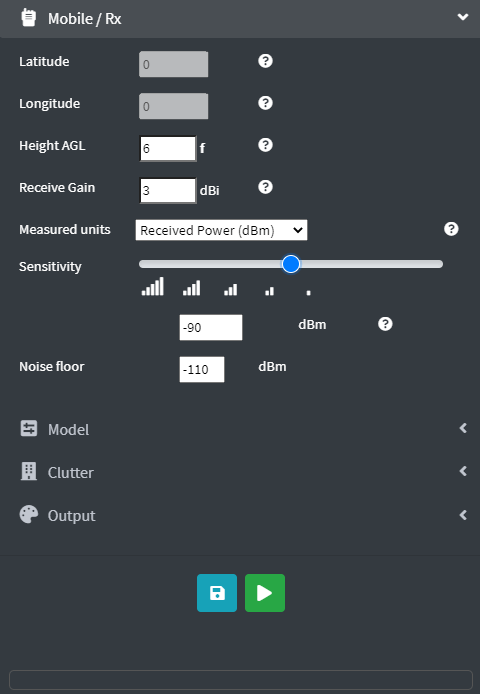
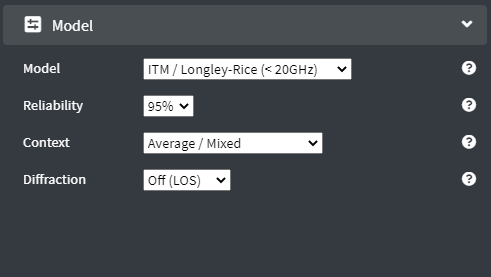
- Model Settings
This tab has to do with the types of algorithms used to determine signal strength. Leave everything default unless you know what you’re doing
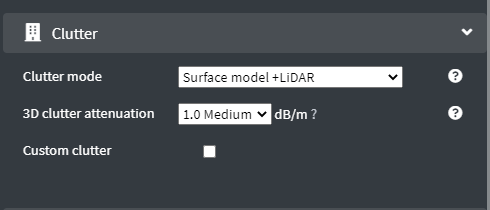
- Clutter Setting
This tab has to do with the model data used to determine signal loss (like trees and buildings). Leave everything default here unless you know what you’re doing.
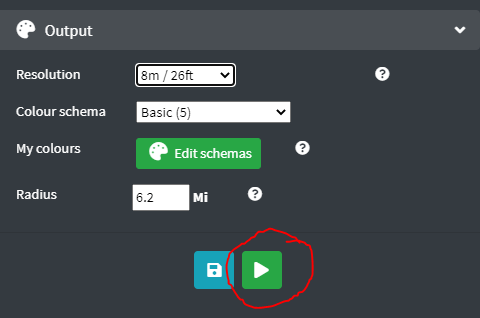
- Output Settings
This tab has to do with miscellaneous variables required for computation. Default = 8m
Resolution – the granular detail level of the model heatmap
colors – changes the color type of the heatmap. Default= Basic
radius – the size of the area used for the map. Default – 6.2 Mi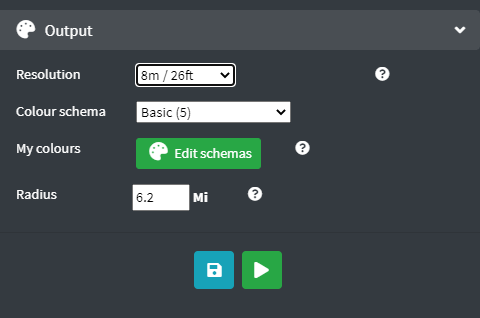
- Press the Green arrow to start calculation
How to Read the Map
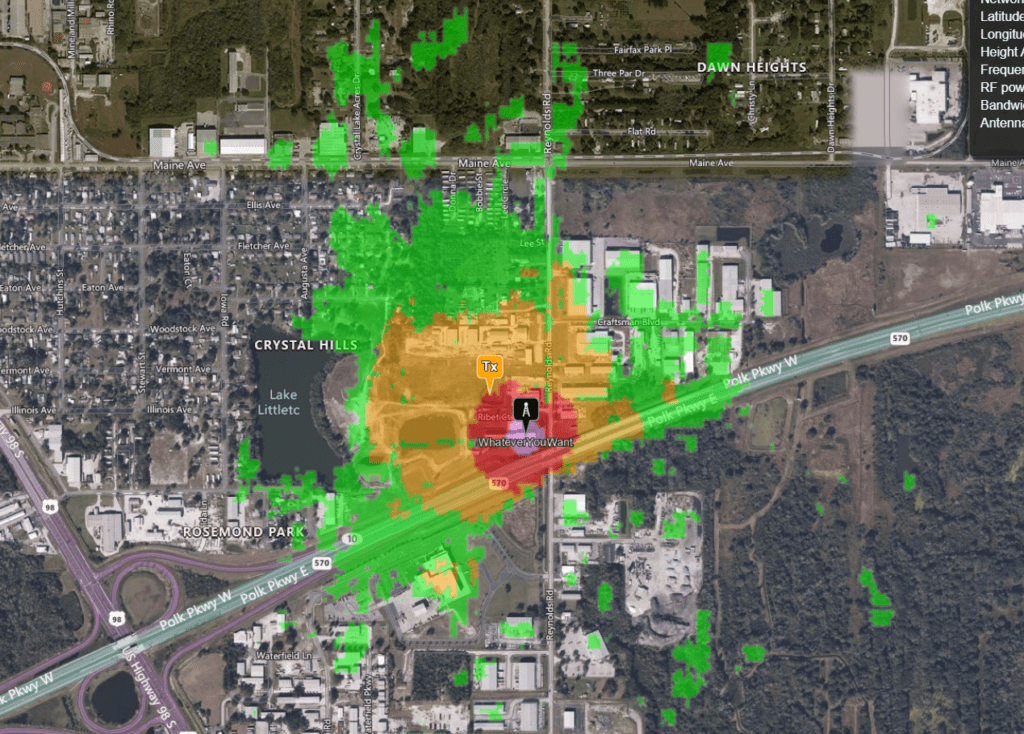
The tool will output a heatmap of the signal strength that your miner generates. The signal strength scale is located at the top right. Remember, because the signal strength is graphed in negative values, the lower the number the better the signal strength.
In my experience, the areas in purple, red and yellow are guaranteed good signal, the areas in green are about 50% chance of communication success, the areas in blue (not seen in the above graph but if you change RX sensitivity it will show) are about 15% chance of communication. The areas with no color have a 0% chance of communication
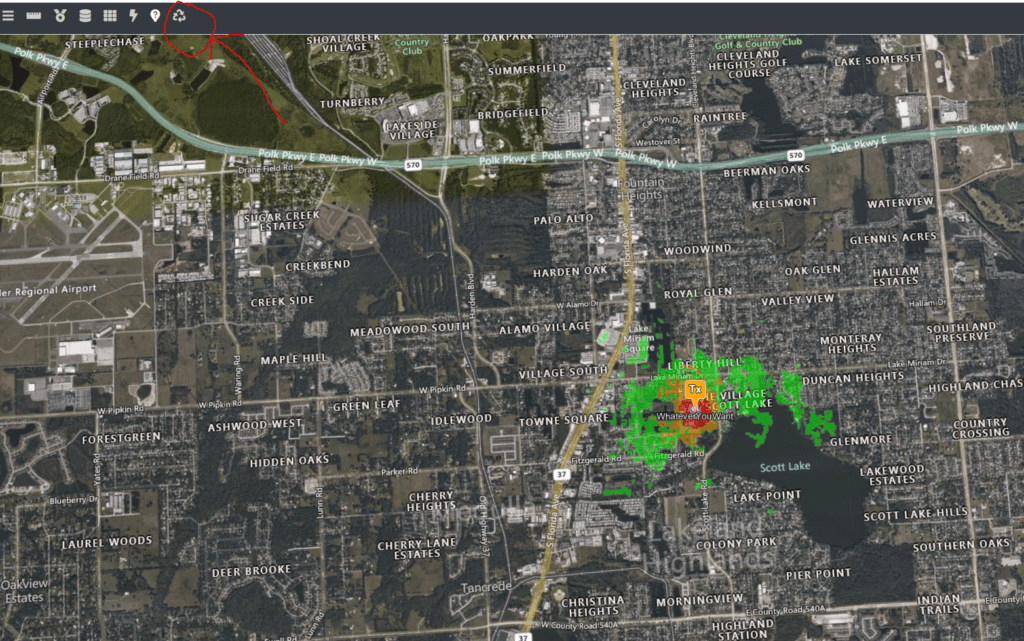
Pro Tip: If you want to clear the output map push this button
Calculated vs Actual
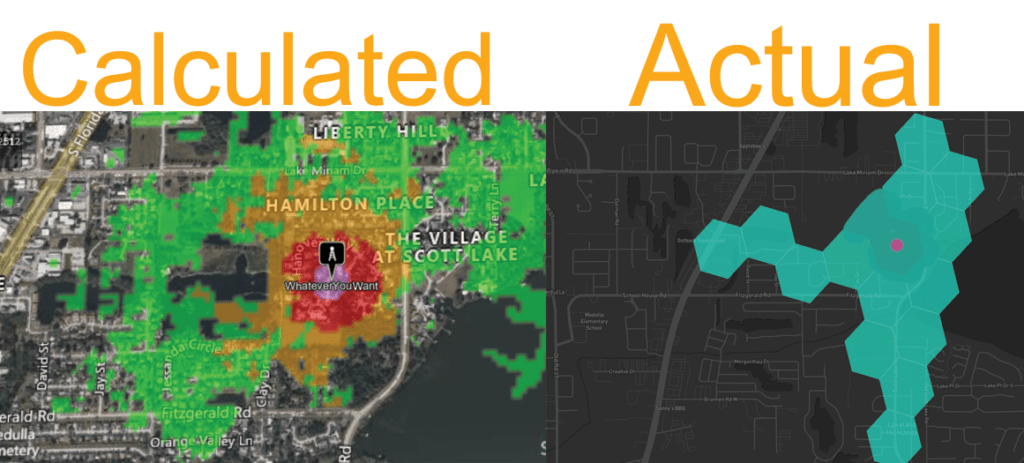
I recently surveyed a wireless site and then calculated what the tool thought. For the most part the tool was pretty reliable – I would say it was probably about 80% accurate with default settings, in this case the tool miscalculated about 2 hexes. With some tweaking, I would say that the tool could likely hit 90% accuracy or greater.
Final Thoughts
This tool may prove invaluable to those who are trying to properly plan their networks, or are curious if their friends’ houses are close enough to be witnesses in POC coverage challenges.